Open In Colab

Overview

This guide explains how to use the Neosantara and E2B Code Interpreter SDK to create a secure cloud sandbox powered by Firecracker. The sandbox includes a running Jupyter server, enabling large language models (LLMs) to execute Python code for tasks such as data analysis and visualization.

Prerequisites

To get started, ensure you have the following:

Get Your Free Neosantara API Key

Sign up at Neosantara to receive 10,000 free Token Credits monthly. No credit card required.
  • Node.js: Version 16 or higher.
  • Python: Version 3.6 or higher.
  • Required Python Packages:

Installation

Install the required Python packages using pip:
pip install e2b_code_interpreter==1.0.0 python-dotenv openai -q
For additional details on available methods, refer to the E2B documentation.

Setup Instructions

1

Create a Python Script

Create a new file, e.g., index.py, to hold your code. Ensure the file has a .py extension.
The script name can be customized (e.g., index.py or my_script.py), but it must be a valid .py file.
2

Configure Environment Variables

Create a .env file in your project directory to store your API keys:
NAI_API_KEY=your_neosantara_api_key
E2B_API_KEY=your_e2b_api_key
Replace your_neosantara_api_key and your_e2b_api_key with the keys obtained from Neosantara and E2B, respectively.
3

Select a Model

Choose a code generation model from Neosantara. Available options include:
  • nusantara-base (default)
  • archipelago-70b
  • Llama-3.3-Nemotron-Super-49B
See the full list of models at Neosantara Models.
4

Dataset Information

The code interpreter uses a dataset located at /home/user/data.csv in the sandbox. The CSV file uses a comma (,) as the delimiter and contains the following columns:
Column NameExample ValueDescription
countryArgentina, AustraliaCountry name
RegionSouthAmerica, OceaniaGeographic region
Surface area (km2)2780400Land area in square kilometers
Population in thousands (2017)44271Population in thousands
Population density (per km2, 2017)16.2People per square kilometer
Sex ratio (m per 100 f, 2017)95.9Male-to-female ratio
GDP: Gross domestic product (million current US$)632343GDP in million USD
GDP per capita (current US$)14564.5GDP per person
Life expectancy at birth, total (years)76.4Average life expectancy
… (and more)See the full list in the example code.

Example Code

Below is a complete example demonstrating how to set up the Code Interpreter, upload a dataset, and create a visualization (e.g., a linear regression chart of GDP per capita vs. life expectancy).
import os
from dotenv import load_dotenv
from openai import OpenAI
from e2b_code_interpreter import Sandbox
import re
import json

# Load environment variables
load_dotenv()

# API keys
NAI_API_KEY = os.getenv("NAI_API_KEY")
E2B_API_KEY = os.getenv("E2B_API_KEY")

# Model selection
MODEL_NAME = 'nusantara-base'  # Alternatives: 'archipelago-70b', 'Llama-3.3-Nemotron-Super-49B'

# System prompt for the LLM
SYSTEM_PROMPT = """You're a Python data scientist. You are given tasks to complete and you run Python code to solve them.

Information about the csv dataset:
- It's in the `/home/user/data.csv` file
- The CSV file is using , as the delimiter
- It has the following columns (examples included):
    - country: "Argentina", "Australia"
    - Region: "SouthAmerica", "Oceania"
    - Surface area (km2): for example, 2780400
    - Population in thousands (2017): for example, 44271
    - Population density (per km2, 2017): for example, 16.2
    - Sex ratio (m per 100 f, 2017): for example, 95.9
    - GDP: Gross domestic product (million current US$): for example, 632343
    - GDP growth rate (annual %, const. 2005 prices): for example, 2.4
    - GDP per capita (current US$): for example, 14564.5
    - Economy: Agriculture (% of GVA): for example, 10.0
    - Economy: Industry (% of GVA): for example, 28.1
    - Economy: Services and other activity (% of GVA): for example, 61.9
    - Employment: Agriculture (% of employed): for example, 4.8
    - Employment: Industry (% of employed): for example, 20.6
    - Employment: Services (% of employed): for example, 74.7
    - Unemployment (% of labour force): for example, 8.5
    - Employment: Female (% of employed): for example, 43.7
    - Employment: Male (% of employed): for example, 56.3
    - Labour force participation (female %): for example, 48.5
    - Labour force participation (male %): for example, 71.1
    - International trade: Imports (million US$): for example, 59253
    - International trade: Exports (million US$): for example, 57802
    - International trade: Balance (million US$): for example, -1451
    - Education: Government expenditure (% of GDP): for example, 5.3
    - Health: Total expenditure (% of GDP): for example, 8.1
    - Health: Government expenditure (% of total health expenditure): for example, 69.2
    - Health: Private expenditure (% of total health expenditure): for example, 30.8
    - Health: Out-of-pocket expenditure (% of total health expenditure): for example, 20.2
    - Health: External health expenditure (% of total health expenditure): for example, 0.2
    - Education: Primary gross enrollment ratio (f/m per 100 pop): for example, 111.5/107.6
    - Education: Secondary gross enrollment ratio (f/m per 100 pop): for example, 104.7/98.9
    - Education: Tertiary gross enrollment ratio (f/m per 100 pop): for example, 90.5/72.3
    - Education: Mean years of schooling (female): for example, 10.4
    - Education: Mean years of schooling (male): for example, 9.7
    - Urban population (% of total population): for example, 91.7
    - Population growth rate (annual %): for example, 0.9
    - Fertility rate (births per woman): for example, 2.3
    - Infant mortality rate (per 1,000 live births): for example, 8.9
    - Life expectancy at birth, female (years): for example, 79.7
    - Life expectancy at birth, male (years): for example, 72.9
    - Life expectancy at birth, total (years): for example, 76.4
    - Military expenditure (% of GDP): for example, 0.9
    - Population, female: for example, 22572521
    - Population, male: for example, 21472290
    - Tax revenue (% of GDP): for example, 11.0
    - Taxes on income, profits and capital gains (% of revenue): for example, 12.9
    - Urban population (% of total population): for example, 91.7

Generally, you follow these rules:
- ALWAYS FORMAT YOUR RESPONSE IN MARKDOWN
- ALWAYS RESPOND ONLY WITH CODE IN CODE BLOCK LIKE THIS:
`\`\`python
{code}
`\`\`
- The Python code runs in a Jupyter notebook.
- Each Python code block is executed in a separate cell.
- Display visualizations using matplotlib or other libraries directly in the notebook.
- You have access to the internet and can make API requests.
- You can read/write files in the sandbox filesystem.
- Install any pip package using `!pip install {package}` if needed (common data analysis packages are preinstalled).
- All code runs in a secure sandbox environment.
"""

# Function to execute code in the sandbox
def code_interpret(e2b_code_interpreter, code):
    print("Running code interpreter...")
    exec = e2b_code_interpreter.run_code(
        code,
        on_stderr=lambda stderr: print("[Code Interpreter] Error:", stderr),
        on_stdout=lambda stdout: print("[Code Interpreter] Output:", stdout),
    )
    if exec.error:
        print("[Code Interpreter ERROR]", exec.error)
        return None
    return exec.results

# Function to extract Python code from LLM response
def match_code_blocks(llm_response):
    pattern = re.compile(r"```python
    match = pattern.search(llm_response)
    return match.group(1) if match else ""

# Function to interact with the LLM and execute code
def chat_with_llm(e2b_code_interpreter, user_message):
    print(f"\n{'='*50}\nUser message: {user_message}\n{'='*50}")
    messages = [
        {"role": "system", "content": SYSTEM_PROMPT},
        {"role": "user", "content": user_message},
    ]
    client = OpenAI(api_key=NAI_API_KEY, base_url="https://api.neosantara.xyz/v1")
    response = client.chat.completions.create(model=MODEL_NAME, messages=messages)
    response_message = response.choices[0].message
    python_code = match_code_blocks(response_message.content)
    if python_code:
        return code_interpret(e2b_code_interpreter, python_code)
    else:
        print(f"No Python code found in response: {response_message}")
        return []

# Function to upload dataset to the sandbox
def upload_dataset(code_interpreter):
    print("Uploading dataset to Code Interpreter sandbox...")
    dataset_path = "./data.csv"
    if not os.path.exists(dataset_path):
        raise FileNotFoundError("Dataset file not found at ./data.csv")
    try:
        with open(dataset_path, "rb") as f:
            file_buffer = f.read()
            remote_path = code_interpreter.files.write('data.csv', file_buffer)
        if not remote_path:
            raise ValueError("Failed to upload dataset")
        print("Dataset uploaded to:", remote_path)
        return remote_path
    except Exception as error:
        print("Error during file upload:", error)
        raise error

# Main execution
with Sandbox(api_key=E2B_API_KEY) as code_interpreter:
    # Upload dataset
    upload_dataset(code_interpreter)
    
    # Example task: Create a linear regression chart
    code_results = chat_with_llm(
        code_interpreter,
        "Create a chart showing the linear regression of GDP per capita vs. life expectancy from the dataset. Filter out missing or invalid values.",
    )
    
    if code_results:
        first_result = code_results[0]
        print("Visualization generated successfully!")
    else:
        raise Exception("No results from code interpreter")

# Display the visualization (e.g., PNG output)
first_result


Running the Code

  1. Ensure the dataset (data.csv) is in the same directory as your script.
  2. Run the script using:
    python index.py
    
  3. View the output: The script uploads the dataset, sends a task to the LLM, executes the generated Python code in the sandbox, and displays the result (e.g., a chart).

Example Output

The example task generates a scatter plot with a linear regression line showing the relationship between GDP per capita and life expectancy, filtered for valid data.
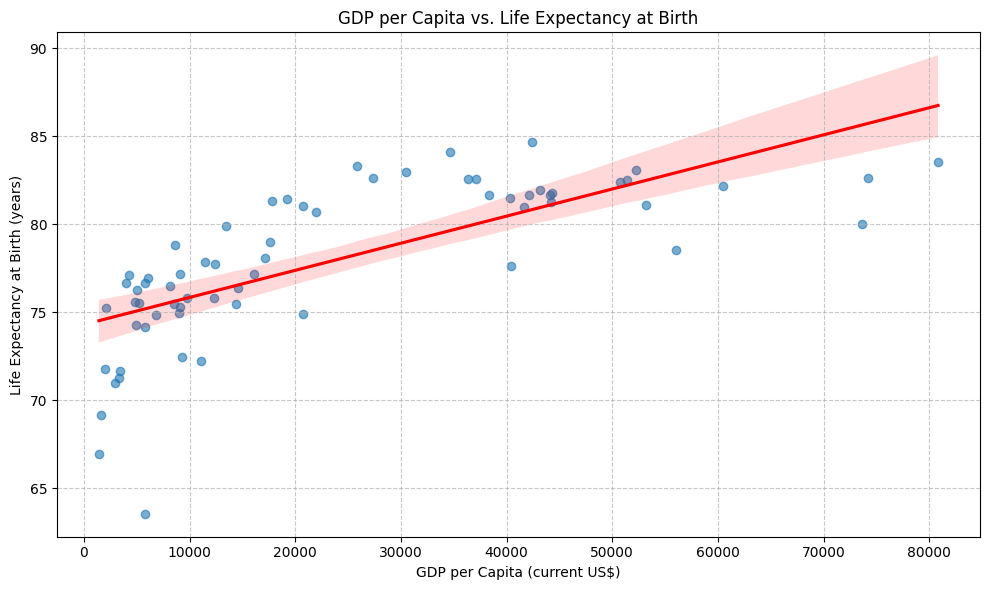
 Result Image

Key Features

  • Secure Sandbox: Code runs in an isolated environment powered by Firecracker.
  • Jupyter Integration: Execute Python code in a Jupyter notebook within the sandbox.
  • Data Visualization: Use libraries like matplotlib or seaborn to create charts directly in the notebook.
  • File Access: Read/write files in the sandbox filesystem.
  • API Support: Make API requests from within the sandbox.
  • Extensibility: Install additional Python packages using !pip install.

Troubleshooting

  • API Key Issues: Ensure your Neosantara and E2B API keys are valid and correctly set in the .env file.
  • Dataset Not Found: Verify that data.csv exists in the script’s directory.
  • Code Execution Errors: Check the console for error messages from the sandbox ([Code Interpreter ERROR]).
  • Missing Python Code: If the LLM response lacks a Python code block, ensure your prompt is clear and specific.
For further assistance, refer to the E2B documentation or Neosantara support.